
If you use Microsoft Planner or Project for the Web, you’re probably familiar with the colored labels you can add to tasks. These can be renamed to whatever you like; they’re used to “flag” tasks.
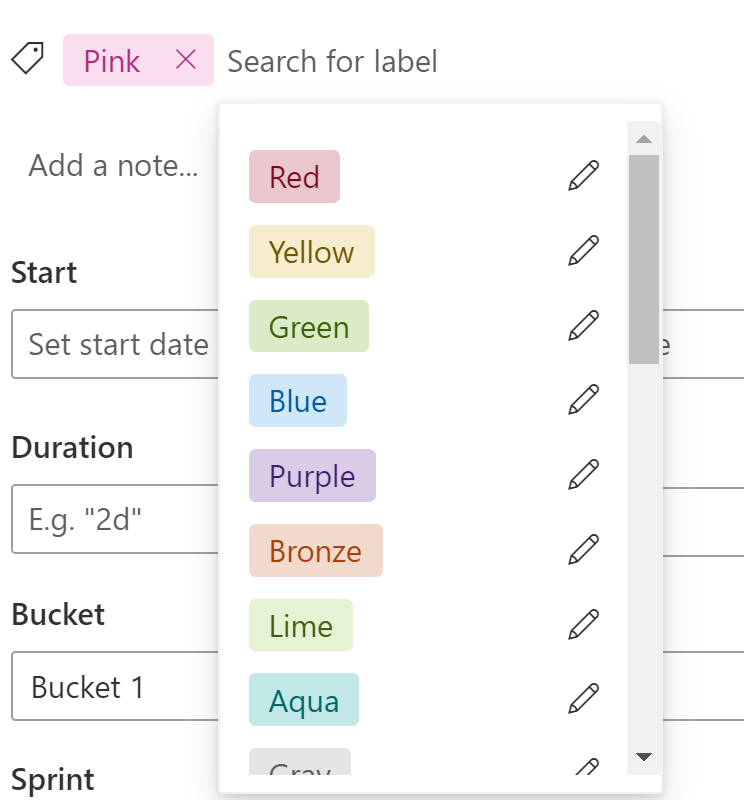
When we pull this task data into Power BI, we lose a lot of the label details. If we’re using basic tier Planner, we keep the color name but not the label text. If we’re using Project for the web, we retain the label text and an ID for the color, but not the actual color value. I really like the idea of getting the task and label data from Dataverse, which is possible with the plan 1 licensing and higher, but it comes through like this:
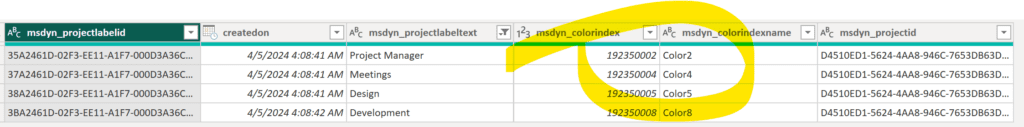
Perhaps somewhere there exists a reference to which color index value is associated with which color label, but I couldn’t find that information anywhere on the public internet or in the available Dataverse tables. Color1 and Color2 are not very helpful either. So, how do we know which color is which?
I went through and hand-extracted them, then used an eyedropper tool to get the hex color codes for each label. 😅
I’ll insert this a few ways for convenience. Below is the HTML table so you can see the colors, under that is a button for the Excel file download.
Color Label Values
| Color Name | msdyn_colorindex | Color Index | Background Color Hex Code | Text Color Hex Code | Sort |
|---|---|---|---|---|---|
| Pink | 192350000 | Color0 | #FBDDF0 | #AC2D7E | 0 |
| Red | 192350001 | Color1 | #E9C7CD | #750B1C | 1 |
| Yellow | 192350002 | Color2 | #F5EDCE | #6D5700 | 2 |
| Green | 192350003 | Color3 | #DBEBC7 | #386304 | 3 |
| Blue | 192350004 | Color4 | #D0E7F8 | #005BA1 | 4 |
| Purple | 192350005 | Color5 | #D8CCE7 | #401B6C | 5 |
| Bronze | 192350006 | Color6 | #F1D9CC | #A74109 | 6 |
| Lime | 192350007 | Color7 | #E5F2D3 | #426217 | 7 |
| Aqua | 192350008 | Color8 | #C2E7E7 | #016767 | 8 |
| Gray | 192350009 | Color9 | #E5E4E3 | #615E5C | 9 |
| Silver | 192350010 | Color10 | #EAEEEF | #4B5356 | 10 |
| Brown | 192350011 | Color11 | #E2D1CB | #4D291C | 11 |
| Cranberry | 192350012 | Color12 | #C50F1F | #FFFFFF | 12 |
| Orange | 192350013 | Color13 | #DA3B01 | #FFFFFF | 13 |
| Peach | 192350014 | Color14 | #FF8C00 | #000000 | 14 |
| Marigold | 192350015 | Color15 | #EAA300 | #000000 | 15 |
| Light Green | 192350016 | Color16 | #13A10E | #000000 | 16 |
| Dark Green | 192350017 | Color17 | #0B6A0B | #FFFFFF | 17 |
| Teal | 192350018 | Color18 | #00B7C3 | #000000 | 18 |
| Light Blue | 192350019 | Color19 | #0078D4 | #FFFFFF | 19 |
| Dark Blue | 192350020 | Color20 | #003966 | #FFFFFF | 20 |
| Lavender | 192350021 | Color21 | #7160EB | #FFFFFF | 21 |
| Plum | 192350022 | Color22 | #77004D | #FFFFFF | 22 |
| Light Gray | 192350023 | Color23 | #7A7574 | #FFFFFF | 23 |
| Dark Gray | 192350024 | Color24 | #394146 | #FFFFFF | 24 |
Okay, but what do I do with this?
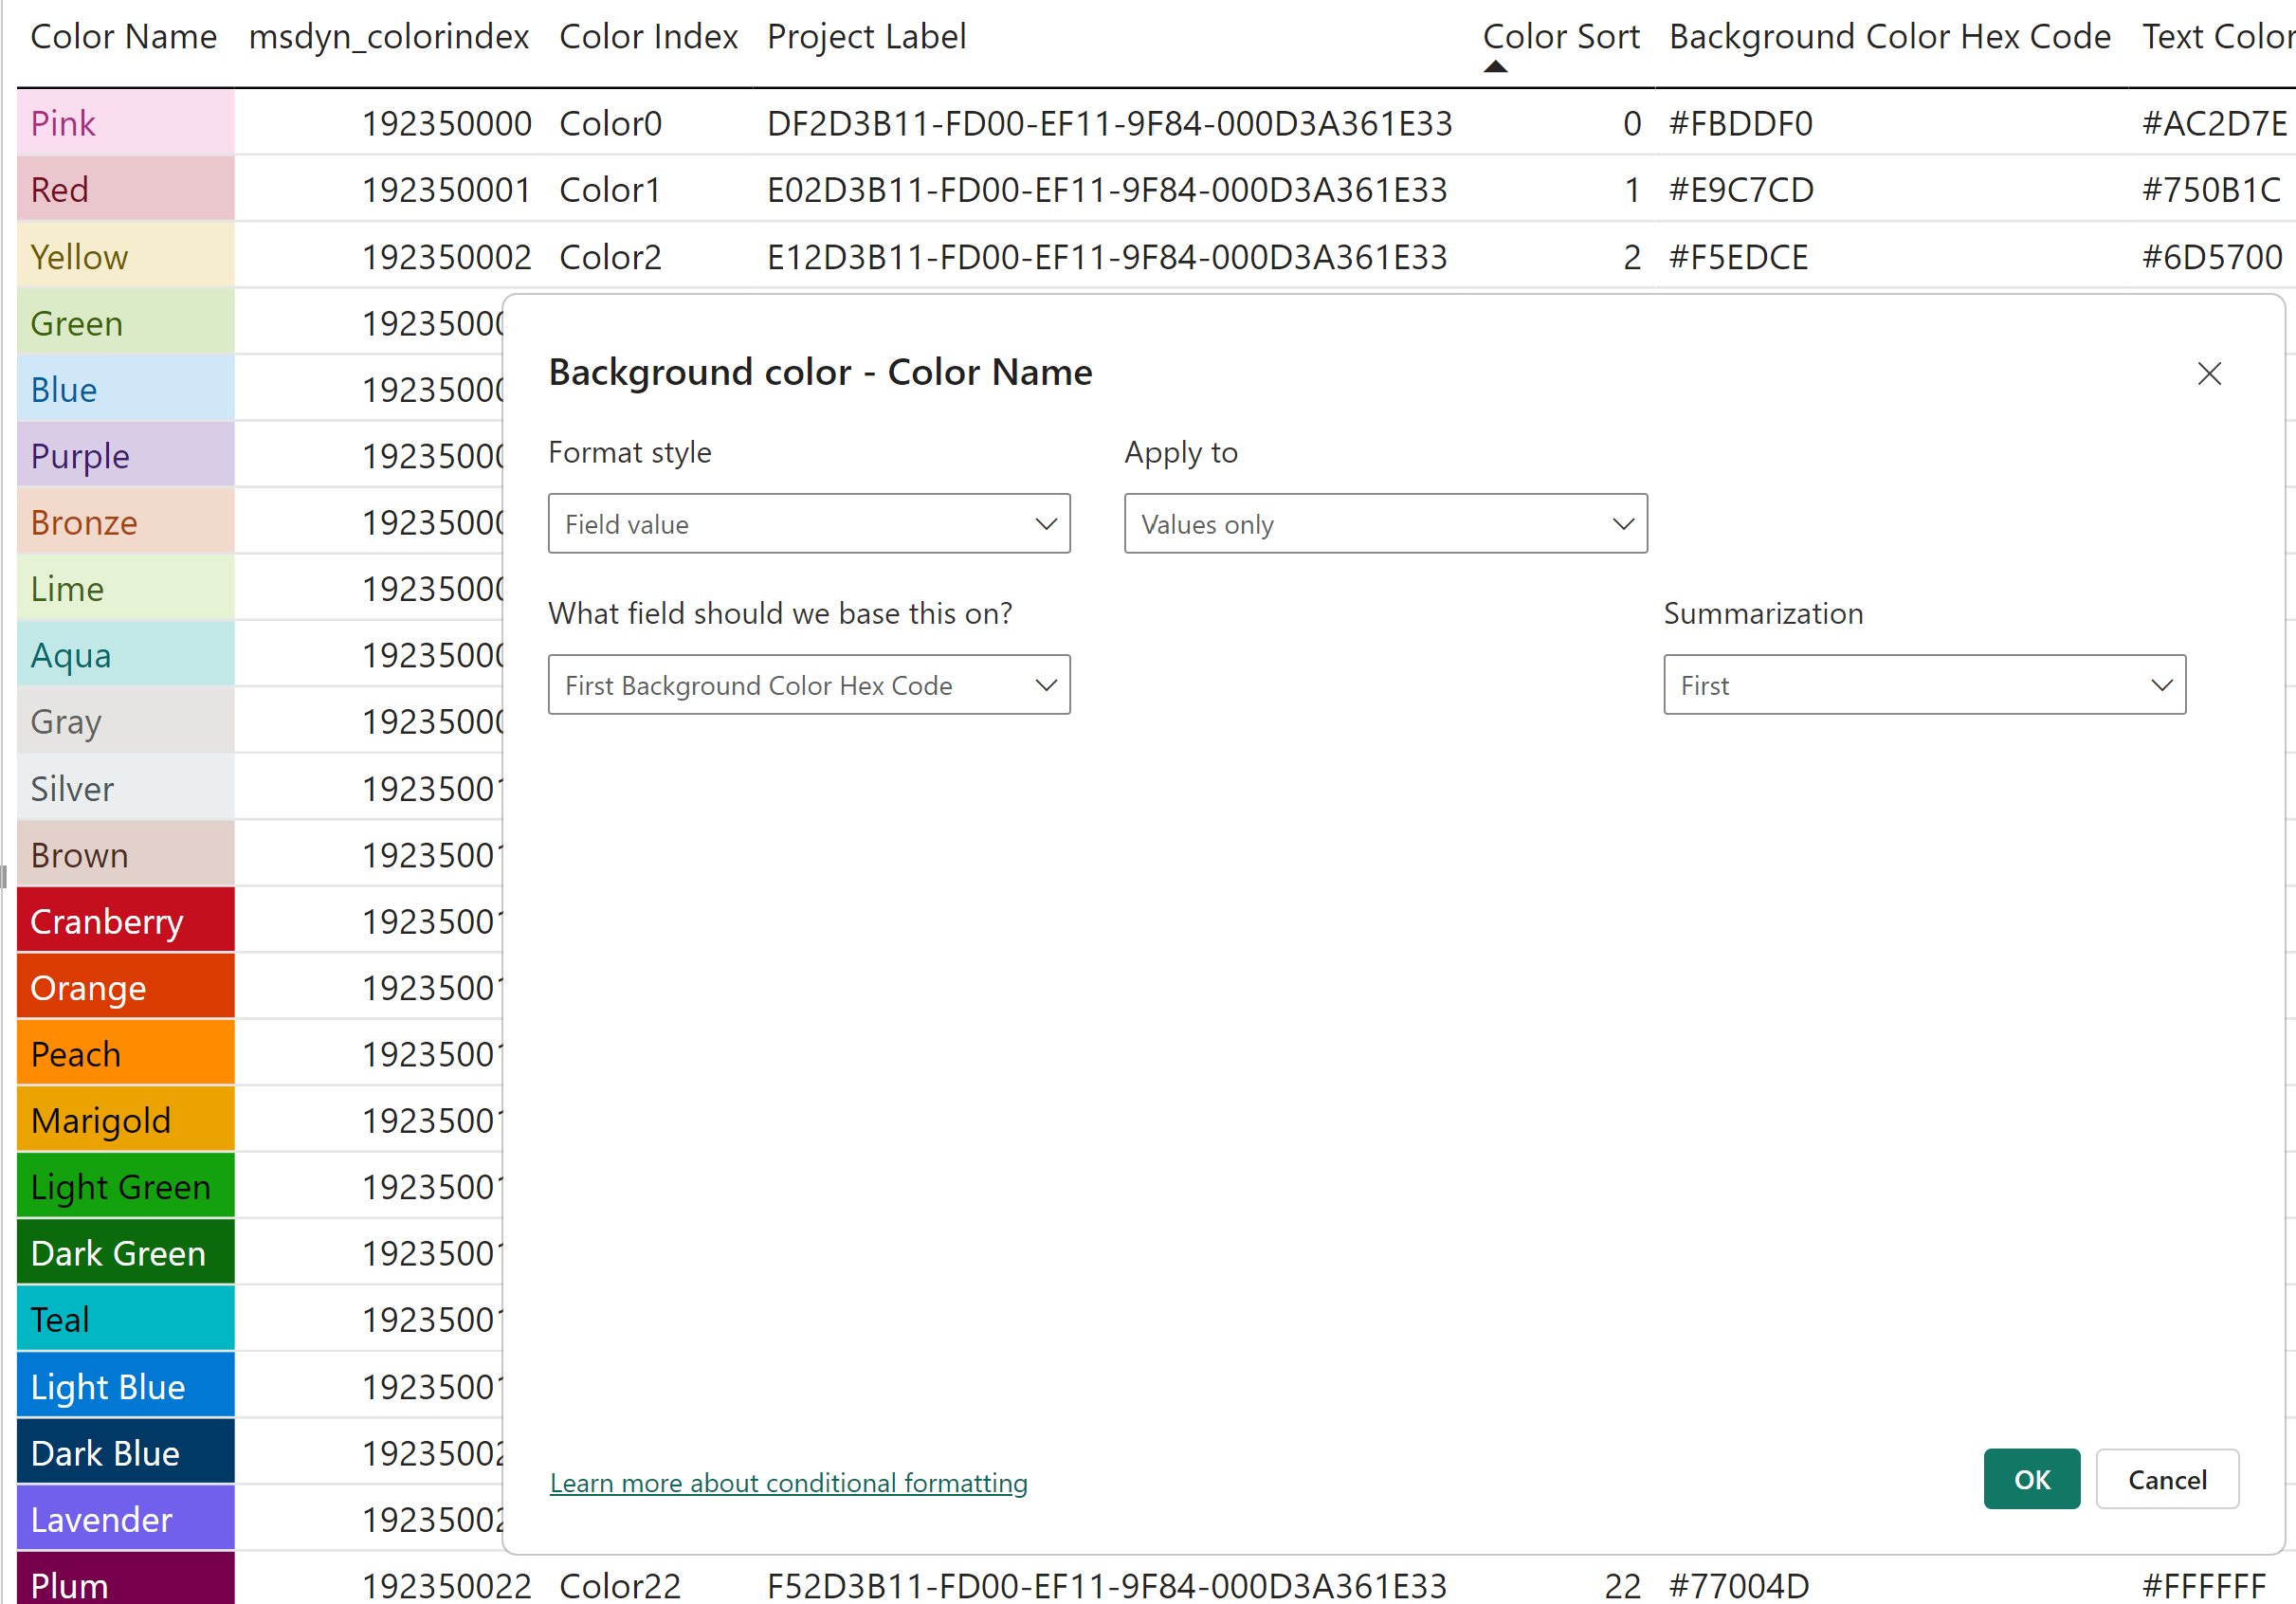
If you’re using Power BI, you can use the Excel file as a data source (either in SharePoint, a dataflow, or just paste it in a data table). You can either relate it to your Dataverse “msdyn_projectlabel” table on the color index (recommended), or left join it in the query editor on the color index and expand to get the color names and hex codes. That’ll let you conditionally color the tag text and background, choosing the format style of “field value”:
Keep in mind that the labels are a multivalue sort of situation, so one task could have multiple color flags. What that means is, if you’re trying to display the color for a task with multiple labels, things suddenly get a lot more complicated – you need to venture into SVG or the HTML visual to display them properly. If you want to keep it simple, though, you could have a conditional column to display a single specific important flag at a time – e.g. the “red” one, formatted red, and display the label text on the tasks with the conditional formatting. You can also use these values as filters on your report by dropping them into the filter pane.
BUT at least now we’re all clear about which color IDs are which, right?