With the advent of TMDL, we’re able to use AI to update our DAX measures to add descriptions and inline comments to our code (this links to the video walkthrough)! Here are the prompts we used to do this as well as test results with different LLM models.
Prompt 1 – Add Descriptions to Measures
Measure descriptions show on hover inside the model, and as of the INFO.VIEW.MEASURES() update to Power BI Desktop, we can display that information directly in the report visuals. We can even do that contextually when the user selects a measure!
What that means, is, we can have AI fill in the gaps in our model to make it easier to understand for our viewers.
To have AI write our measure descriptions, we hand it a TMDL export (if you’re not sure how to get the TMDL export, please see the video linked in the first paragraph of this post) of our measure information and ask it to add descriptions – the /// syntax is how these are added:
Please help me add and update descriptions for each measure by inserting description text in a new row above each “measure” line. Each description should be prefixed by ///

Use business-friendly terms, describing what the measure does both from the context of the measure name and from the DAX. When you summarize the DAX, explain it as text, not just a copy of the code - people reading these descriptions do not know any DAX. Output the full code with descriptions for ALL measures, keeping the tab structure exactly the same.

Descriptions should not be longer than 500 characters.
After we get our descriptions, we can opt to have AI comment our code for us – it can do this for all of our measure at once, IF it fits in the token limit of our model.
Prompt 2 – Add //Comments to DAX Measures
Code comments help developers understand what is going on with our DAX so that they can make updates to it or maintain it down the road. They’re inserted directly inside the code so that they’re visible when a developer is looking at the formula. In this example, I take the output from Prompt 1 and tell it to add comments. Here’s the prompt I used to do this:
Now please add //comments INSIDE the DAX to explain what each piece of the DAX is doing in context. Use the code attached, keeping the structure the same but adding comments on new lines inside the expression code.The output of this then gets pasted back into the TMDL view, run, and voila – all our measures are commented and have descriptions!
Which model is best?
I tried this with GPT-4o in GitHub Copilot for VS Code, Claude 3.7 Sonnet, GPT-o3 mini high (supposedly best for logic and reasoning) and GPT-o1 pro (“best” at reasoning).
Notably, I don’t have a terribly complex model to try this on right now that is publicly shareable, so I’m curious to see how it works on more complicated measures. Before I get called out on that – I know! If you have a complicated model, try it out yourself and tell us how it performs. 😄
Just for fun, I fed the outputs of the models to Chat GPT and asked it to rank them – it ranked Claude most highly at a 7.5 out of 10, and the rest at 6. I’m not sure what would have constituted a 10/10, but I thought both Claude and o1-pro did pretty well. o1 pro even added what each measure “helps” with, generally, which I guess is useful.
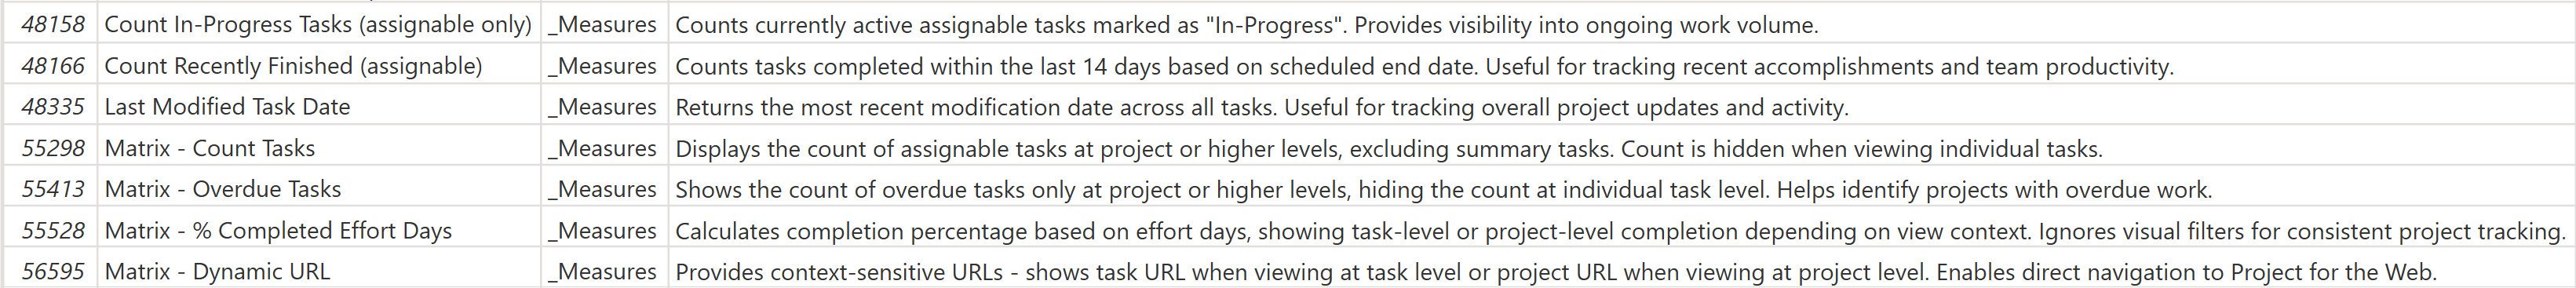
Here’s a sample of the outputs. If you’re wondering what the ‘assignable only’ business is about, this is Planner premium data where it creates the subtasks and tasks in a single flat table, but parent tasks are not assignable to a person and thus not “true” tasks – they’re just used for a grouping in the UI, so I filter them out of most measures.
Claude helped write the HTML for the table below! Claude did NOT help write the rest of this post.
AI Model Output Comparison
| Measure | GitHub Copilot 4o | Claude 3.7 Sonnet | GPT-o3 mini high | GPT o1-pro |
|---|---|---|---|---|
| % Completed Effort (assignable) | This measure returns the percentage of completed effort for tasks, excluding summary tasks to prevent double-counting. | Calculates the percentage of completed effort across assignable tasks, based on effort days. Provides more accurate progress tracking than simple task counts. | Determines the percentage of completed effort for assignable tasks by dividing completed effort by planned effort, indicating project progress. | Indicates how much of the total assignable effort has been completed, comparing the sum of completed effort to the total planned effort. Helps track progress beyond just task counts. |
| % Completed Tasks (assignable only) | This measure returns the percentage of completed tasks. | Shows the percentage of assignable tasks marked as complete. Used to track overall task completion progress. | Computes the percentage of completed assignable tasks by comparing completed tasks against the total assignable tasks. | Shows the share of completed tasks among all assignable tasks. Helps stakeholders quickly assess task-level completion progress. |
| % Tasks Overdue (assignable) | This measure returns the percentage of overdue tasks. | Calculates the percentage of assignable tasks that are overdue. Key metric for project health monitoring. | Calculates the percentage of overdue assignable tasks by dividing the overdue count by the total assignable tasks. | Calculates the percentage of tasks that are overdue by dividing the overdue task count by total assignable tasks. Ideal for an at-a-glance project health metric. |
| Count Completed Tasks (assignable only) | This measure returns the count of tasks that are completed. | Counts completed assignable tasks. Used to track finished work items and calculate completion ratios. | Returns the count of completed assignable tasks, assisting in tracking overall team progress. | Counts tasks with Status = “Complete”, excluding summary tasks. Helps track how many tasks have reached completion. |
| Count In-Progress Tasks (assignable only) | This measure returns the count of tasks that are in progress. | Counts currently active assignable tasks marked as “In-Progress”. Provides visibility into ongoing work volume. | Counts assignable tasks that are currently in progress, enabling managers to monitor active work. | Counts tasks currently in-progress, excluding summary tasks. Good for seeing how many tasks your team is actively working on. |
You can see that Copilot starts each description with “this measure”, which is a bit repetitive. GPT-o3 mini sounds very … logical and developer-ish, which I guess I should have expected from the model that was “good at coding” – I guess “good at coding” perhaps means more consistent and regimented, not good at describing code to non-coders.
Thoughts?
I honestly love where this is going with TMDL + AI. My guess is that Copilot will be doing this for us inside the desktop app very soon, but I personally like to be able to control the model used (and I don’t have Copilot capacity yet!) so I may be using this copy/paste method for a while.
The time savings aspect here is huge – I take longer than average to write DAX, because it doesn’t stick in my brain very well. I typically have to go look up the documentation every time I do something more complicated than a CALCULATE with filters, so I will totally be onboard with AI speeding that up.